Licensed Users Dashboard
Dashboard
Once authenticated, licensed users are directed to the portal’s dashboard, which is organized into three primary sections.
Dashboard (section 1)
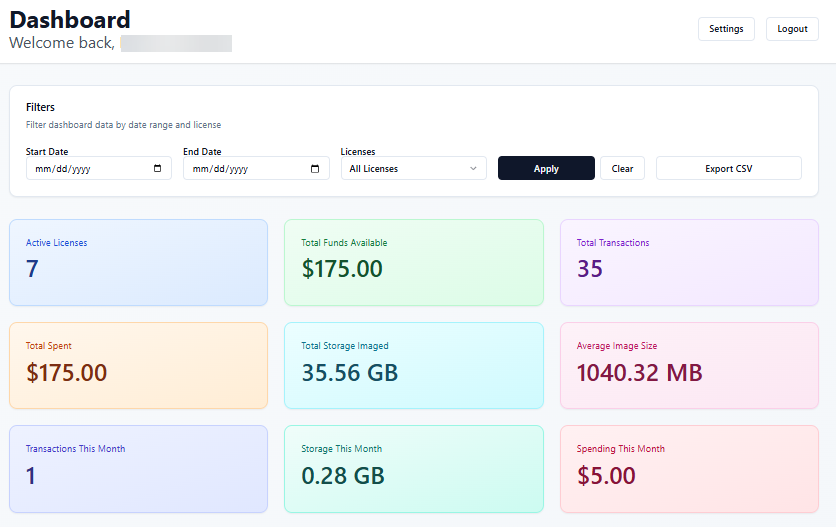
The first section, illustrated below, displays nine Key Performance Indicators (KPIs) related to license transactions. This allows users to capture the essence of all registered imaging activities in a single view.
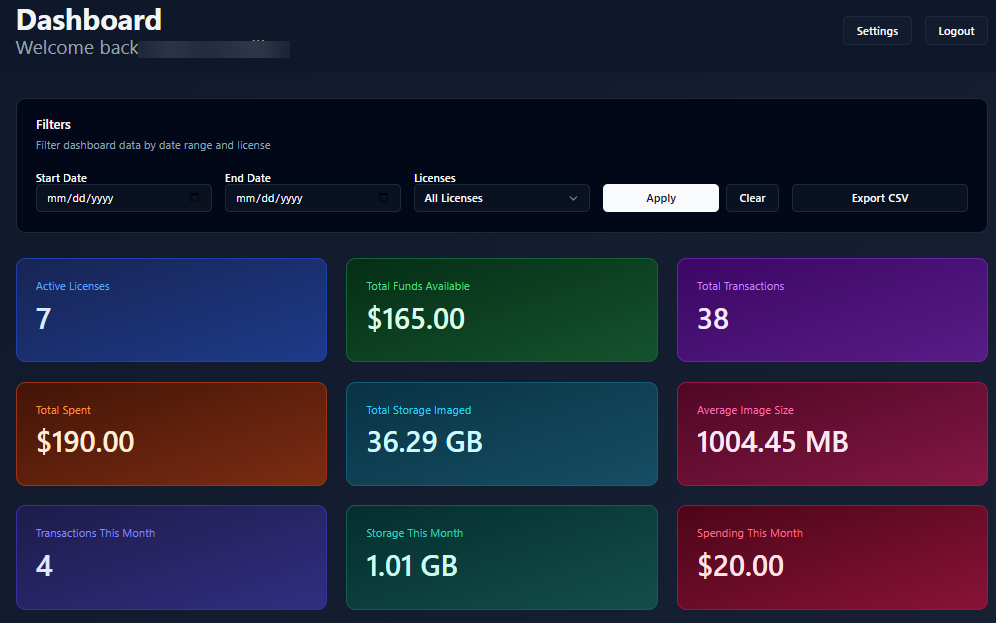
Dark mode Sample
Dashboard (section 2)
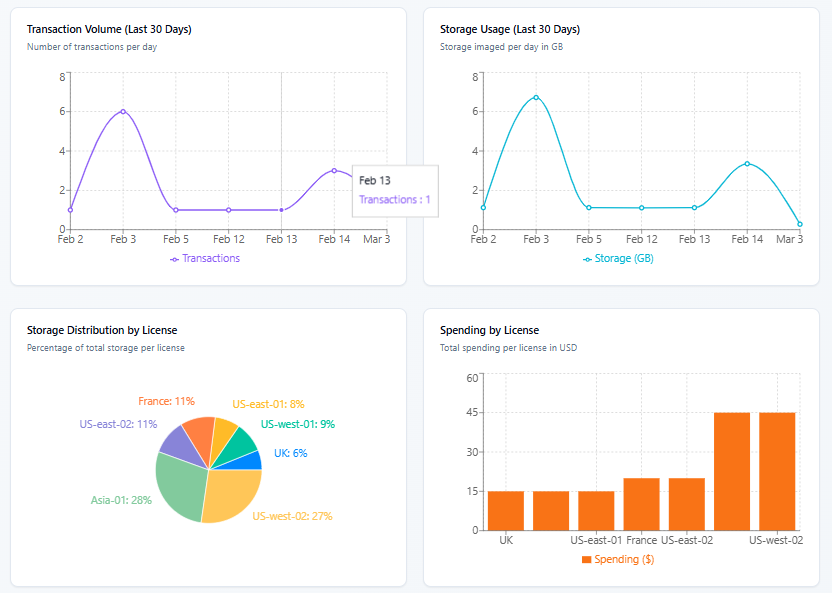
The second section of the dashboard provides a high-level visual assessment of user performance through four interactive charts.
Activity Trends (Upper Tier): Two primary line charts track performance over time. The first monitors the total number of transactions, while the second displays storage usage throughout the monthly period.
Distributing and cost (Lower tier): Activity by License (Bottom Left): A pie chart breaks down imaging activities by license. Spending by License (Bottom Right): A bar chart displays the financial expenditure associated with each license.
These charts are important for moving beyond raw data to actionable intelligence.
Dashboard (section 3)
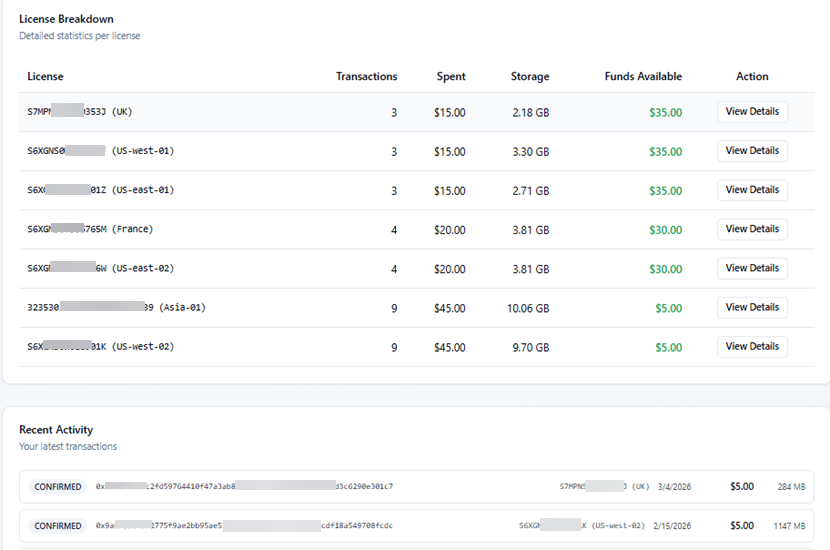
The final section of the dashboard provides a detailed breakdown of specific license usage and real-time activity tracking.
License Summary: A tabular overview summarizing total transactions and data volume consumed for each active license.
Recent Activity: A list of the 10 most recent transactions, displaying key metadata such as the acquisition timestamp, device ID, and registration status.
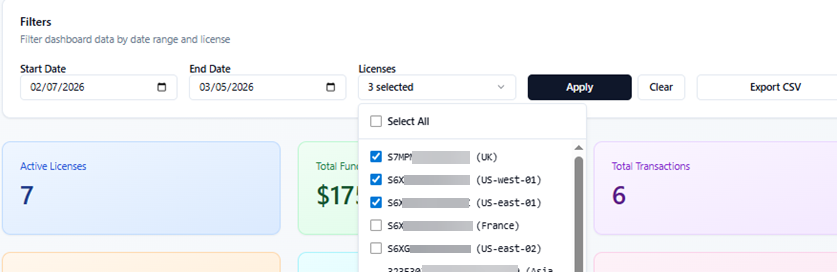
Dashboard (Filter)
Users can filter all the dashboard information by date (submission date) and by license serial, as shown in the image below.